-
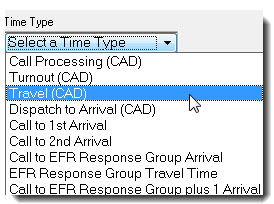
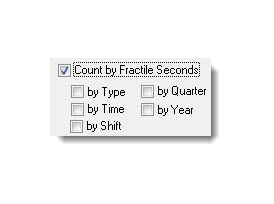
1. Create Fractile Reports
Crunch the numbers with fractile reports. Select from many different fractile measurements and options.
view now » -
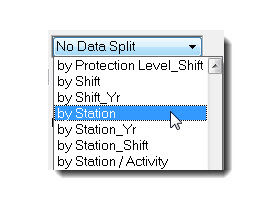
2. Run Fractile Comparisons
Do you want to compare performance by station, by shift or dozens of other criteria. Use this fractile reporter when you want to create comparisons.
view now » -
3. Make Fractile Graphs
Create a variety of fractile graphs showing compliance percentage over time as well as time to 90% compliance by station or by hour of day.
view now » -
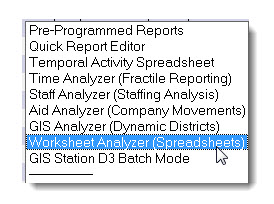
4. Create a Worksheet Table
Worksheets may be created using just about any field in a table. You can analyze counts, percentages and 90% performance.
view now » -
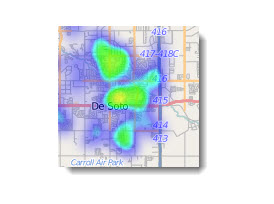
5. Make Heatmaps
StatsFD allows you to create heatmaps in seconds. Simply select records and click on the GIS analyzer.
view now » -
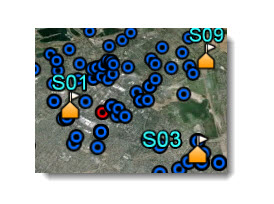
6. Run Point Maps
StatsFD produces KML code that can be read by on-line maps servers like Google Earth. Click on any point to see a description of the incident.
view now » -
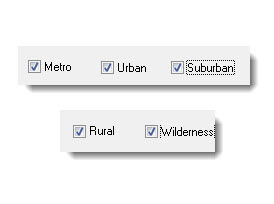
7. Setup Protection Levels
StatsFD allows you to setup a grid of equally-size analysis district. Each district can be assigned to a population level listed above.
view now » -
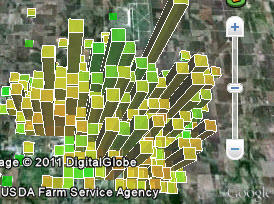
8. Run 3D Performance Maps
StatsFD KML files can also be used to map demand and performance. Color indicates performance, height indicates incident volume.
view now » -
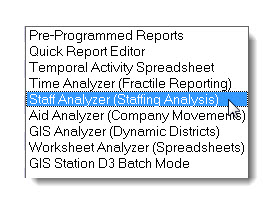
9. Analyze Staffing Patterns
Is your staffing meeting the demand for service? Find out by running the Staff analyzer. Use animated graphs to monitor stress over time.
view now » -
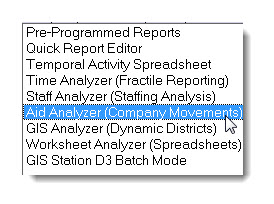
10. Analyze Aid
StatsFD allows you to monitor aid between fire departments as well as aid in and out of local station districts.
view now » -
11. Jurisdictional Profile
The Jurisdictional Profile can generate hundreds of pages of demand, distribution and concentration statistics in just a few minutes.
view now » -
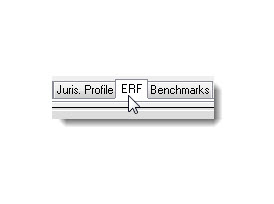
12. Run ERF Analysis
Effective Response Force calculations can be made in three ways; by apparatus type, by locally defined apparatus type and by personnel count.
view now » -
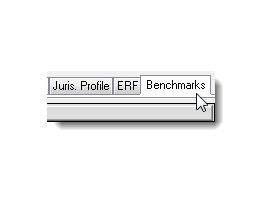
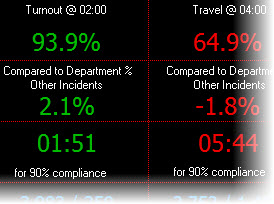
13. Benchmarks & Baselines
Creating a new Benchmarks and Baselines report can require hundreds of calculations OR it can be a single operation in StatsFD
view now » -
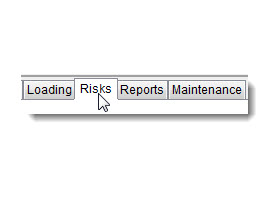
14. Create Risk Records
StatsFD has the ability to automatically create risk records from your incident history. Each risk record contains a complete incident history.
view now » -
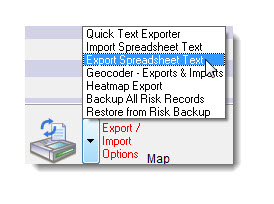
15. Export / Import Risks
Rapidly export, edit and import risk records. It's all done with Excel allowing risk records to be divided by station for spreading-out the edit load.
view now »
How to
Analyze

Copyright © 2023 Animated Data,
Inc. All Rights Reserved.